8 Key Metrics Your Science Organization Should Be Tracking in GA4
By Jordan Eller
The transition from Universal Analytics to GA4 has completely changed the way your science organization should be monitoring website traffic.
It’s absolutely crucial that your marketing team understands the key metrics they should be tracking, and what each metric means for your science org as a whole. Whether you’re new to Google Analytics or are interested in optimizing your data in GA4, we’ve compiled a list of the top 8 most important metrics to track, what they mean, and why you should be tracking them.
Users
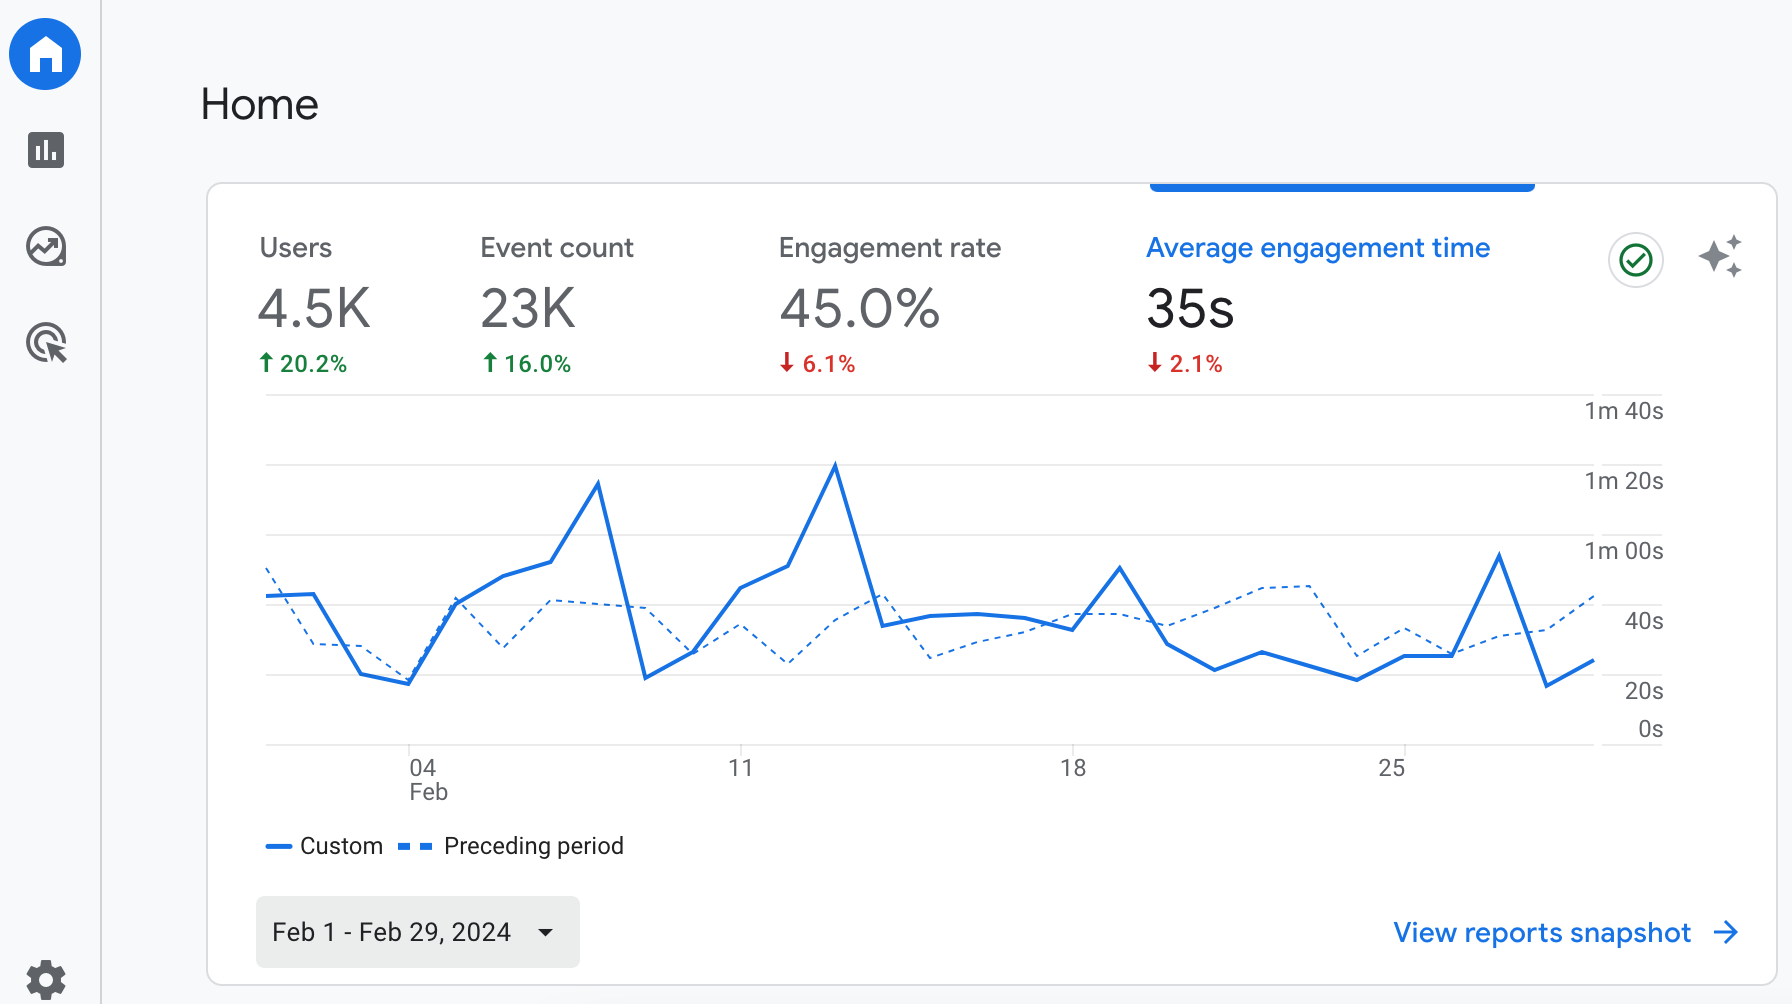
- What is it? Users are visitors who interact with your website. Each user is counted uniquely, so one user who interacts with your website multiple times will still only count as 1 user.
- Where is it? The total number of users can be found on the homepage dashboard. The date range can be adjusted at the bottom of the pane.
- Why is it crucial? Getting a count of the total number of website users during a specific time range can give you a helpful overview of site traffic. User data is also segmented by behavior and demographics in GA4, allowing you to understand more about your audience.
Sessions
- What is it? Sessions track your website traffic, similar to users. However, while the users metric tracks a visitor to your website one time, sessions track every time someone visits your site. According to GA4’s rules, a session expires after 30 minutes of being idle. If a user engages with your website again after 30 minutes of inactivity, it will be counted as a new session.
- Where is it? Like users, you can find the total number of sessions on the homepage dashboard.
- Why is it crucial? Sessions add valuable insight into how users engage with your science website. Tracking sessions, particularly when considered alongside other metrics, helps your marketing team understand issues related to user behavior and retention.
Views per User
- What is it? Views per user tracks the average number of pages viewed per person.
- Where is it? This metric can be found under the GA4 Reports section by clicking on “Engagement” and then “Pages and screens.”
- Why is it crucial? Knowing the average views per user helps you understand how much content users are consuming on your site before navigating elsewhere.
Engagement Rate
- What is it? The engagement rate is measured as the percentage of engaged sessions out of total sessions. GA4 considers a session an “engaged session” if it meets any of these criteria:
– Lasts more than 10 seconds
– Includes a conversion
– Has at least 2 page views - Where is it? Engagement rate can be found under the GA4 Reports section by clicking on “Acquisition” and “User Acquisition.”
- Why is it crucial? Engagement rate illustrates whether your content is reaching the correct audience. High engagement rates indicate that site visitors are interested in your site, while low engagement rates could mean that changes are needed in order to effectively engage with your audience.
Seeing low engagement rates across your science website? It could be your content! Learn how to avoid boring life science content in this blog from the Forma library: 3 Reasons Why Your Marketing Content is Boring (And How to Fix It)
Key Events [Previously Conversions]
- What is it? Key events are events that you manually specify as being important to your business. An example of a key event might be submitting a contact form or generating a lead. You can define an event as a key event by to Admin Settings, clicking on “Data Display,” then “Events,” and then toggling on the switch that says “Mark as Key Event.”
- Where is it? You can see the number of key events that have occurred on each page of your site in the reports section under “Engagement” and “Pages and screens.”
- Why is it crucial? Marking specific events on your site as “key events” enables you to see which parts of your site have a bigger impact on your business as a whole and which areas need improvement.
E-commerce Data
- What is it? For scientific companies selling products on their websites, tracking e-commerce behavior on your website is crucial to understanding how visitors are making purchases (or in many cases, not making purchases). Some e-commerce measurements are:
– Add to Carts – The number of times that the “add to cart” event is triggered
– Items Purchased – How many items were purchased in total and per product
– Revenue – Revenue from items purchased (taxes and shipping not included) - Where is it? E-commerce analytics are found in the Reports section of Google Analytics under the “Monetization” section.
- Why is it crucial? Utilizing e-commerce data helps you organize your products and website by understanding which channels are driving purchases, how users are navigating your site, and which marketing efforts are effective.
Traffic Source
- What is it? Traffic source shows how users are arriving at your site via various channels. It displays how users discovered your website, such as through email, ads, social media, and more.
- Where is it? Traffic source is available in reports by clicking on “Acquisition” and “Traffic acquisition.”
- Why is it crucial? Monitoring traffic sources helps you understand how users find your website. It allows you to identify which marketing channels are driving traffic to your site and how users engage with your content. This can help you make marketing decisions, such as whether more money and time should be spent on Google ads rather than social media advertising.
Landing Pages
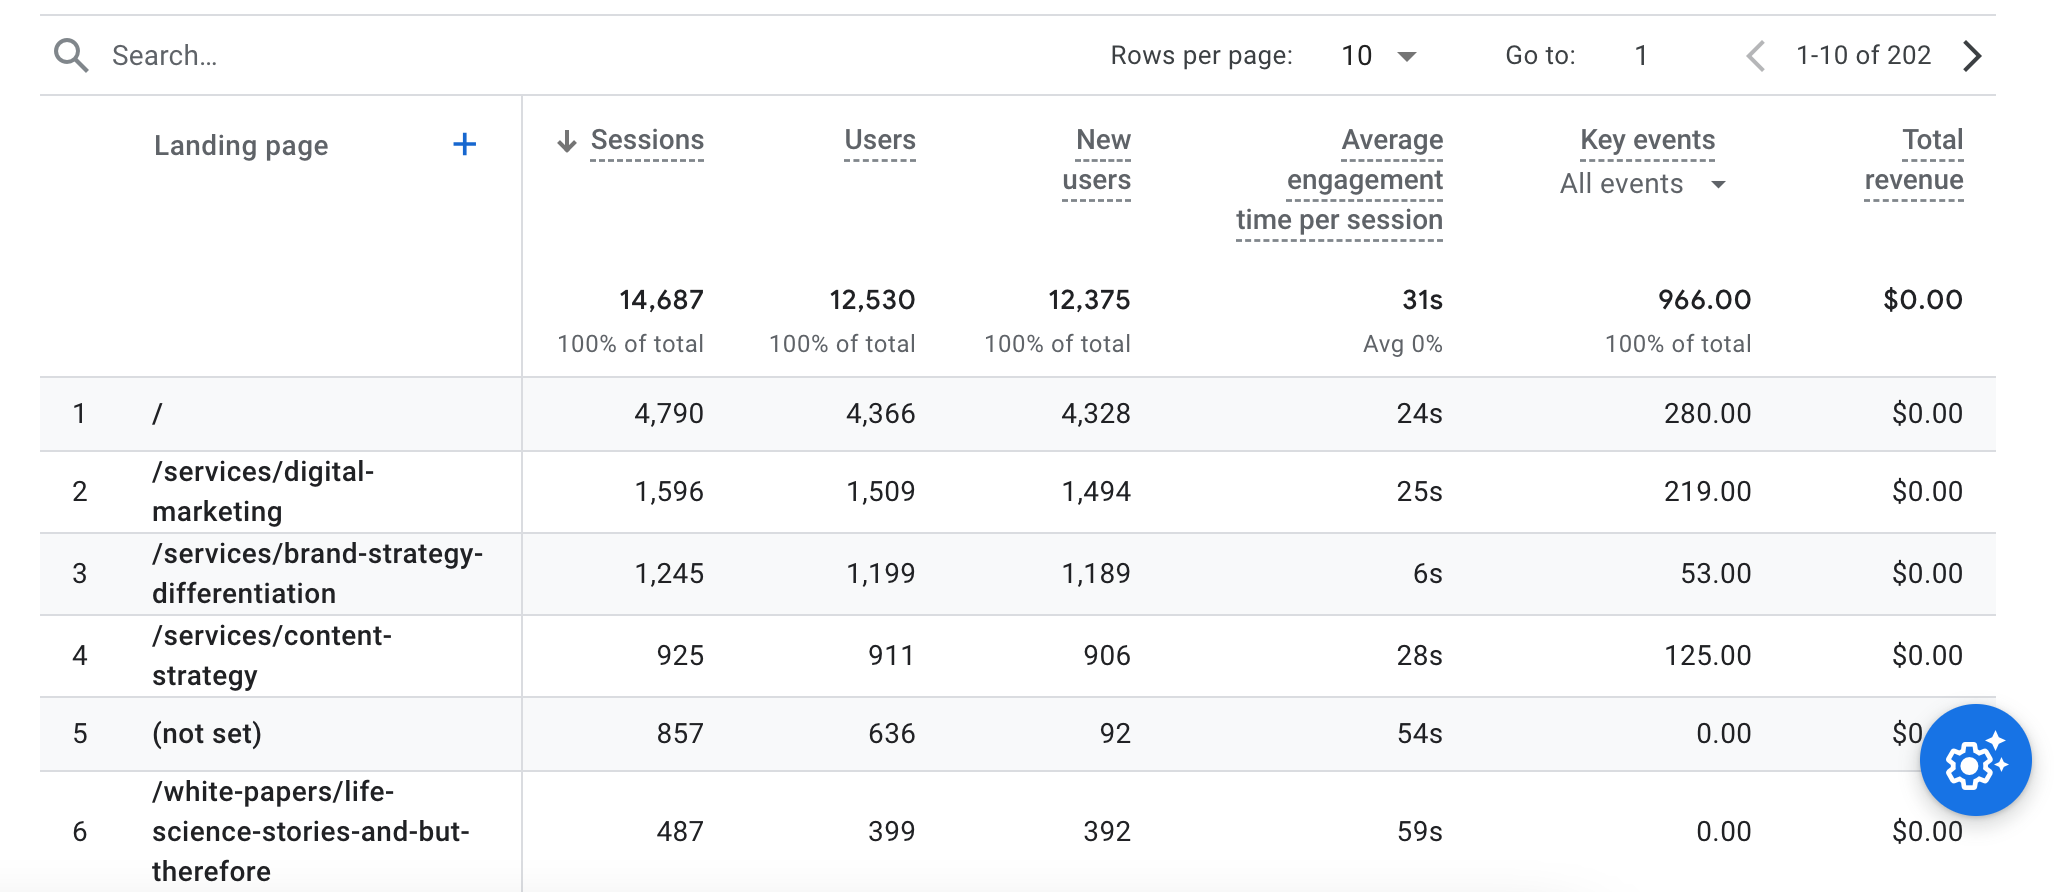
- What is it? A landing page is the page that users visit first when arriving at your site. Examples of this could be your website’s homepage, a services page, or a blog post.
- Where is it? Landing page information is available in Reports by clicking on “Engagement” and “Landing page.”
- Why is it crucial? Landing page metrics help you understand where users are first seeing your content. It can also help you monitor the effectiveness of marketing campaigns by seeing which pages of your site receive the most visitors.
If you’re in the market for a trusted agency partner to help make the most of your website data (and more), start the conversation with Forma today and learn how we can help your science org expand its digital footprint.